Topanish Door
Choosing aluminum doors and windows involves more than comparing prices or inspecting a polished showroom sample. How to compare the quality of different aluminum doors and windows starts with checking equivalent sizes, frame designs, glazing, and intended uses. Otherwise, a heavier specification may simply reflect a different product, not better workmanship. Details matter.
This guide examines practical signs you can verify: frame dimensions, corner joints, thermal breaks, weather seals, drainage paths, glass specifications, hardware, and surface finishes. Look closely at sample corners and opening edges. Ask for product data and test reports that match the exact model, rather than relying on broad performance claims. A smooth handle is useful, but it cannot prove that a window will resist air or water leakage. Looks can mislead.
Installation also affects performance. A well-made frame can still leak if it is poorly measured, supported, or sealed against the wall. Compare warranty terms and clarify who handles service before ordering. Where possible, inspect a finished installation after rain, and note whether doors close evenly or seals appear compressed. No single feature settles the question. Even careful buyers may overvalue thick profiles or attractive finishes; I would treat those as clues, not conclusions. The comparisons ahead offer a more balanced way to judge quality, ask suppliers specific questions, and recognize where available evidence remains incomplete.
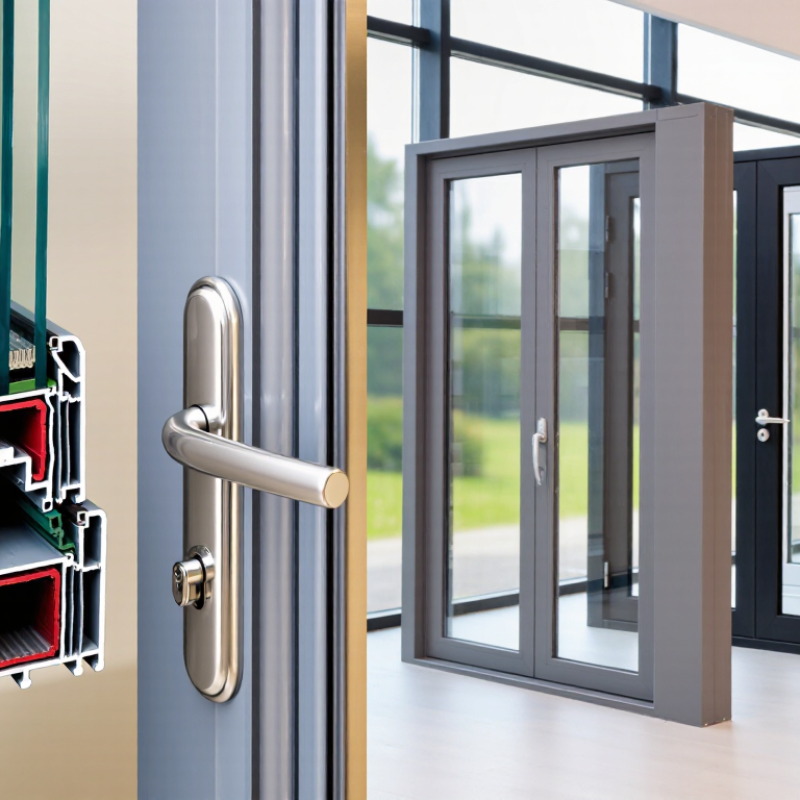
A profile can look flawless and still have the wrong alloy or temper. Ask for a mill test report tied to the exact extrusion lot, not a generic certificate. Check the alloy, temper, chemical composition, and tensile-test results against ASTM B221/B221M, which covers aluminum-alloy extruded profiles and related products. Numbers reveal more. For example, the standard’s property tables give 6063-T5 minimum tensile and yield strengths of about 22 ksi and 16 ksi, while 6063-T6 is about 30 ksi and 25 ksi for applicable product dimensions. The required values can vary with section size, so compare the report with the matching table and edition.
Then inspect the metal itself. A clean saw-cut sample should show consistent walls, without thin corners, deep die lines, or obvious twists. Measure critical wall thickness and frame dimensions with calipers; compare them with the approved drawings and stated tolerances. An alloy designation alone proves little if the temper is missing. Check the lot number on the paperwork against the packaging or production label. Ask whether tensile results came from the supplied lot or a separate sample. That distinction is easy to miss. ASTM conformity also does not automatically verify every finished-door feature, such as corner strength, drainage, or coating durability. Those need separate checks. I would not treat a polished surface as evidence of strong metal. It is a tempting shortcut.
When comparing aluminum doors and windows, ask for section drawings, not just brochure silhouettes. Measure frame-wall thickness on a cut sample with calipers, checking the main frame and sash separately. A thicker wall may resist denting, but alloy temper, reinforcement, corner keys, and span also affect strength. Thickness alone can mislead. Review project-specific calculations and test reports against AAMA/WDMA/CSA 101/I.S.2/A440 (NAFS), which evaluates air, water, and structural performance. There is no single thickness that guarantees quality.
Sightlines affect both daylight and stiffness. Compare visible frame widths on drawings for the same opening size, then inspect corners and mullion joints. Narrower is not automatically better. A slimmer profile may require reinforcement, especially on tall or wide units. The U.S. Department of Energy’s Energy Saver guidance estimates that windows account for about 25–30% of residential heating and cooling energy use. Sealing details matter beyond appearance.
On delivered samples, measure frame diagonals, sash clearance, gasket compression, and corner alignment with feeler gauges. Ask for documented fabrication limits and inspection records, then compare several units. ASTM E283 and E331 specify tests for air leakage and water penetration; request the test pressure, specimen size, and results. Numbers need context. A small mismatch may be harmless, but recurring gaps, rubbing hardware, or uneven seal contact deserve investigation. Recheck after installation.
Compare frame wall thickness, sightlines, and fabrication tolerances—then verify each item against the project specification.
The bars show a practical inspection-priority guide, not test results or a product rating. There is no single wall-thickness, sightline, or tolerance value that suits every system; compare measured samples with the drawings, applicable standards, and project requirements.
Check: frame and sash wall thickness; frame depth; visible sightline; corner-joint fit; frame diagonals and squareness; sash-to-frame clearance; hardware alignment and operation; gasket continuity and compression; glazing bite and setting; and drainage paths.
Compare like with like: same opening style, glazing layers, spacer, and frame configuration. NFRC ratings describe whole-product performance, not glass alone. U-factor measures heat transfer; lower values mean less heat passing through the assembly. Check the label’s units carefully. NFRC labels commonly use U.S. customary units, so convert before comparing values shown in W/m²·K. The U.S. Department of Energy’s Energy Saver guidance explains that lower U-factors reduce heat flow through windows. Small differences matter. For aluminum frames, ask whether the tested unit includes a thermal break; bare metal conducts heat readily.
SHGC measures how much solar heat enters through the product. The DOE guide gives the rating on a scale from 0 to 1: a 0.30 rating represents about 30% of incident solar heat admitted. That figure is not a promise of identical comfort in every room. A sunny west-facing window may benefit from lower SHGC, while a cold, shaded site may favor more winter sun. Compare NFRC-certified values for the exact door or window configuration, then weigh them against orientation and shading. NFRC’s Certified Products Directory can help verify listed ratings. I would not choose by one number alone; frame details and installation can still change the real-world result.
The figures below are illustrative whole-product comparison examples, not ratings for specific products. Actual NFRC-certified values vary by size, glazing, frame design, and configuration. Compare products of similar dimensions and check the NFRC label or certified directory for verified ratings.
| # | Quality Check | What to Compare | Illustrative Data or Benchmark | How to Interpret It |
|---|---|---|---|---|
| 1 | NFRC U-Factor | Whole-window or whole-door heat transfer, reported in W/m²·K. | Basic aluminum double glazing: 2.8 Thermally broken, low-e double glazing: 1.8 Thermally broken triple glazing: 1.3 |
Lower is generally better for reducing heat flow. Treat these as representative examples, not guaranteed product ratings. |
| 2 | NFRC SHGC | The fraction of incident solar heat admitted through the product, shown as a value from 0 to 1. | Lower-solar-gain example: 0.25 Moderate-gain example: 0.40 Higher-gain example: 0.60 |
Lower SHGC can help limit cooling loads in sunny climates; higher SHGC may be useful where winter solar heat is desired. |
| 3 | Thermal Break in the Frame | Whether a low-conductivity material separates the interior and exterior aluminum frame sections. | Compare a non-thermally broken frame with a thermally broken frame; use their certified whole-product U-Factors for the numerical comparison. | A thermal break reduces heat conduction through the aluminum frame, but its effectiveness depends on the complete frame and glazing design. |
| 4 | Glazing Configuration | Number of panes, pane spacing, and whether the insulating glass unit uses air or gas fill. | Common configurations include double glazing with a sealed cavity and triple glazing with two cavities. | Additional panes and gas-filled cavities can improve insulation, but compare whole-product U-Factor rather than glass-only claims. |
| 5 | Low-E Coating | Whether the glass has a low-emissivity coating and how the coating is selected for the climate. | Compare the product’s certified U-Factor and SHGC with and without the specified low-e glazing option. | Low-e coatings can reduce radiant heat transfer. Their effect on solar gain varies by coating and glazing configuration. |
| 6 | Air Leakage | Tested air leakage for the complete operable product, using the same test method and units when comparing. | For a common U.S. rating convention, lower leakage in cubic feet per minute per square foot (cfm/ft²) indicates a tighter product. | Less uncontrolled air movement can improve comfort and energy performance. Check the applicable local standard and certified test results. |
| 7 | Water Penetration Resistance | Tested resistance to water entry under a stated pressure, particularly for exposed or wind-driven-rain locations. | Compare the product’s reported water-penetration test pressure with the project’s design requirements. | A higher test pressure can indicate greater resistance under the test conditions; installation and drainage details also matter. |
| 8 | Structural and Wind Performance | Design-pressure or structural-test results for the product size and configuration being considered. | Compare certified or documented pressure ratings against the building’s required design pressure. | Ratings are configuration-specific. Larger units, different operating styles, and glazing choices may have different limits. |
| 9 | Condensation Resistance | Frame and glass-edge design, thermal bridging, and any available condensation-resistance test information. | Where a standardized condensation-resistance rating is provided, compare products tested using the same scale and method. | Better thermal performance can reduce condensation risk, but indoor humidity, outdoor temperature, and installation affect results. |
| 10 | Hardware, Seals, and Installation Details | Locking points, weather seals, drainage paths, operating-cycle information, and installation requirements. | Compare documented test results, replaceable-seal availability, and the manufacturer’s written installation instructions. | Durable components and correct installation help preserve air, water, and thermal performance over the product’s service life. |
Comparing aluminum doors and windows starts with test conditions, not a single pass label. ASTM E283 measures air leakage across a specimen under a stated pressure difference. Ask for the reported leakage rate and the test pressure. Compare results only when specimen size, configuration, and pressure are similar. A low number may look impressive, but mismatched conditions make it hard to judge. Details matter.
For water resistance, ASTM E547 evaluates penetration under cyclic static air pressure while water is applied to the exterior. Check the pressure sequence, test duration, and any reported leakage or water entry. Look closely. A pass does not guarantee the same result in every building; installation, drainage paths, and exposure can change performance. Request the complete report, not just a summary sheet.
ASTM E330 assesses structural performance under uniform static air pressure. Review the applied positive and negative pressures, measured deflection, and any permanent deformation after loading. Make sure the tested frame includes the relevant glass, hardware, and operating configuration. A result for one assembly may not represent a larger unit. It is easy to overread a pass result; treat it as useful evidence, not a promise. These reports help compare products, but field workmanship still deserves careful attention.
Coating performance should be checked against documented test results, not judged by color alone. AAMA 2604 and 2605 define performance requirements for architectural coatings, including weathering, corrosion resistance, and adhesion. AAMA 2605 generally involves more demanding exposure requirements than 2604. Ask for a current test report that identifies the coating system and standard version. A glossy sample can look convincing under showroom lights. Looks can deceive. Inspect cut edges, corners, and drainage areas, where thin coverage or small defects may become visible. Compare samples after outdoor exposure when possible, but remember that a brief site check cannot replace laboratory testing.
Hardware deserves the same evidence-based review. Request cycle-test documentation for hinges, locks, rollers, or operators, and confirm which component and test method the report covers. A cycle count alone tells little if the tested hardware carried a lighter load than your actual window or door. Check whether the report notes operation, wear, and adjustment after testing. Then open and close a full-size sample several times; listen for scraping and feel for uneven resistance. It is easy to overvalue a smooth showroom unit. I would also ask how routine adjustments are handled, because even a well-tested assembly can need attention after installation. Standard requirements and test scopes can change, so verify the cited documents before comparing bids.
It measures heat transfer through the complete window or door assembly. Lower values mean less heat passes through. Check the units. Compare matching frames, glazing, and spacers.
It indicates how much incoming solar heat passes through the product. A rating of 0.30 represents about 30% of incident solar heat. A west-facing room may benefit from a lower rating. I wouldn’t choose by this number alone.
Ask for the leakage rate and test pressure. Compare results only when pressure, specimen size, and configuration are similar. A low number can mislead. The conditions matter.
No. The test applies water under changing pressure, but real results also depend on installation, drainage, and exposure. Request the full report. Check the drainage paths.
Check positive and negative pressures, frame deflection, and any lasting deformation. Confirm the tested unit used relevant glass and hardware. A larger assembly may behave differently.
Request a current report identifying the coating system and performance requirements. The 2605 level generally involves tougher exposure requirements than 2604. Inspect corners and cut edges. Looks can deceive.
They document repeated operation of specific components, such as hinges or rollers. Check the tested load and reported wear or adjustment. A cycle count alone tells little.
They offer useful evidence, not a guarantee. Installation and adjustment still matter. Open a full-size sample; listen for scraping and feel for uneven resistance. I might still overvalue a smooth showroom sample.
How to compare the quality of different aluminum doors and windows starts with checking whether the alloy, temper, and extrusions meet the relevant ASTM B221 requirements. Compare frame wall thickness, sightline dimensions, and fabrication tolerances to understand how consistently each product is made and whether its design suits the intended opening. For energy performance, review NFRC-rated U-factor in W/m²·K and solar heat gain coefficient (SHGC), considering the needs of the building and local climate.
Also examine documented test results for air leakage under ASTM E283, water penetration under ASTM E547, and structural performance under ASTM E330. These tests help show how frames and assemblies respond to weather exposure and applied loads. Finally, assess coating durability against AAMA 2604 or 2605, as appropriate, and check that hardware has passed cycle testing. Comparing specifications and test evidence side by side provides a practical basis for evaluating durability, comfort, and overall performance.